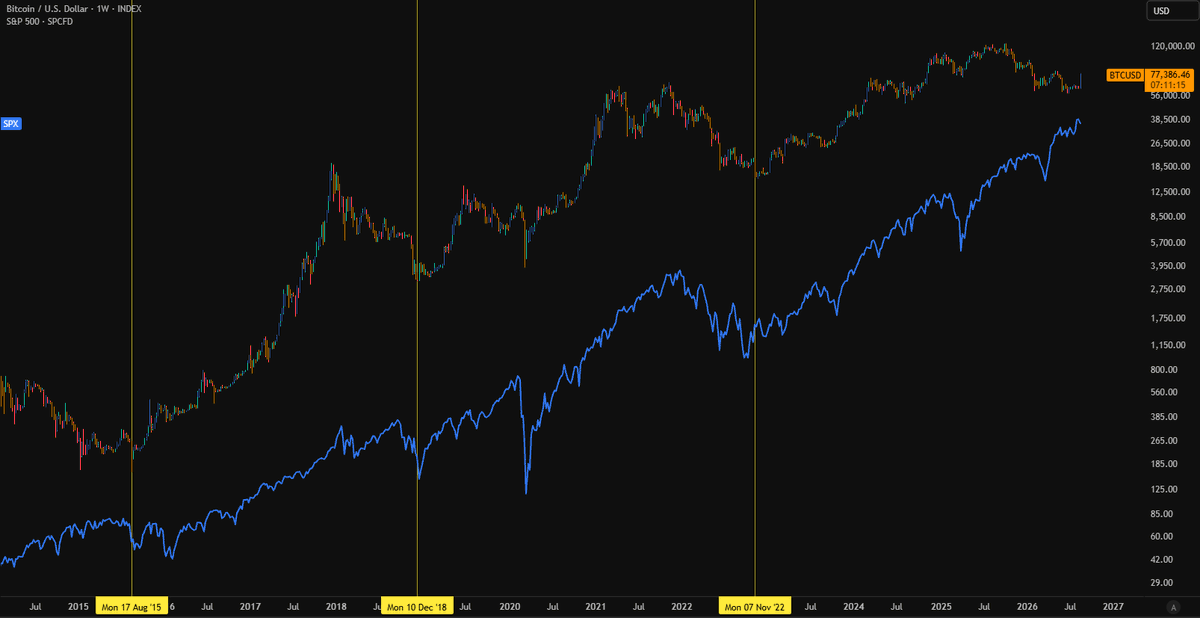
🔥WOW: BITCOIN IS ENTERING FACE-MELTING TERRITORY🔥
If you are bullish on Bitcoin, you're gonna want to check this out.
Bitcoin just started EATING SELLERS ALIVE.
I went looking for on-chain evidence that this week's move was actual seller exhaustion + demand absorption rather than another methamphetamine bear-market rally produced in a Telegram basement.
The on-chain data is ridiculous.
For the 14 days before the breakout:
1. aSOPR was below 1 on 13/14 days
2. Short-Term Supply SOPR was ≤1 on 13/14 days
3. Bitcoin went basically nowhere: +0.25%
So what does that mean, in English?
aSOPR tells us whether coins being spent across the network are realizing profits or losses.
Below 1 = coins are being sold at losses.
STS SOPR does the same thing specifically for short-term supply - the financially traumatized population that bought recently and has spent the last six months staring at a Ledger like it's a terminally ill family member.
For 2 weeks, those people kept realizing losses.
And Bitcoin stopped going down. Then something changed.
Over the latest 7-day window: BTC: +24.37%.
You might assume sellers simply vanished. Wrong!
Short-Term Supply Coin Days Destroyed actually increased 25.7% week-over-week.
STS CDD measures economically meaningful spending activity from younger Bitcoin supply.
Previous week: 8.31M STS CDD
This week: 10.45M STS CDD
MORE short-term coin-age was being destroyed.
MORE coins were economically active.
And BTC responded by launching from ~$63K to $78,325.
That's absorption. The market didn't need sellers to leave. It became strong enough to swallow them.
And then the profitability regime flipped.
Average aSOPR: 0.9927 → 1.0058
Average STS SOPR: 0.9971 → 1.0134
By Friday:
aSOPR: 1.0426
STS SOPR: 1.044
So Bitcoin went from absorbing short-term holders capitulating at losses…
…to absorbing short-term holders taking ~4% realized profits…
WITHOUT PRICE ROLLING OVER.
This is the important part. I built a simple metric:
SELLER ABSORPTION EFFICIENCY
7-day BTC return divided by short-term CDD, normalized against its trailing 365-day median.
Translation:
How much upward price movement are buyers generating relative to the amount of short-term supply actually being spent?
Current reading: 3.19
That's the HIGHEST IN 3 YEARS.
And the 4th highest in 5 years.
There is a bearish historical counterexample worth acknowledging.
February 2022 had even higher raw absorption efficiency.
But aSOPR/STH SOPR only managed:
1.009 / 1.008. Barely above breakeven.
Today: 1.0426 / 1.044.
This profitability flip has considerably more teeth.
And the closest modern structural analogue I find?
January 14, 2023.
That setup subsequently produced:
90D: +45.5%
180D: +50.1%
1Y: +99.0%
Analogue ≠ prophecy. But the mechanics today are extremely difficult to dismiss.
Loss sellers spent two weeks throwing inventory into a market that refused to break.
Then price exploded. Short-term spending INCREASED.
Profit-taking returned. And price accelerated anyway.
That's not an absence of sellers.
That's buyers walking into the slaughterhouse, buying the entire inventory, purchasing the building, firing the manager and asking if there's anything else in the freezer.
Seller exhaustion is when selling stops mattering.
And this week… it stopped mattering.
 35 reposts 23 replies 475 likes
|
|