Sponsored by

| |
|
Bitcoin
|
|
Affairs
|
|
|
|
No. 047 · 12 Jul 2026
|
|
|
|
MARKET SNAPSHOT
|
BTC / USD
$63,995
|
|
24H CHANGE
-0.5%
|
|
| |
ALL-TIME HIGH
$124,749
|
|
FROM ATH
-48.7%
|
|
|
|
U.S.-Iran exchange widens as Strait of Hormuz disruption threatens a Monday macro reset
|
|
Washington struck targets in Iran after an attack on a civilian vessel, and Tehran retaliated against several Gulf states. With about a fifth of traded oil and natural gas normally moving through Hormuz, the escalation raises the risk of a renewed energy shock that could hit global risk assets, including bitcoin, when markets reopen.
|
| Geopolitics Macro |
|
|
|
Fidelity’s long-term power-law model puts bitcoin near a key accumulation zone
|
|
Fidelity macro director Jurrien Timmer says bitcoin is approaching the lower support band of a power-law model that has caught every major bottom since 2015, with support near $58,000. He is not calling a bottom yet, but says the lack of a liquidity catalyst could leave BTC grinding sideways near support for months.
|
| Macro |
|
|
|
Bitcoin’s BIP 110 deadline approaches with miners still showing virtually no support
|
|
The proposal would temporarily restrict non-financial data on Bitcoin, but miner signaling remains below 1% and influential figures including Michael Saylor and Adam Back have come out against it. With adoption weak on both the miner and node sides, the fight looks more likely to produce a minority fork than a network-wide change.
|
| On-chain Mining |
|
|
|
Empery Digital sells half its bitcoin stash to finance AI data centers
|
|
Empery sold 1,400 BTC for about $87.1 million and said it may sell more as it pivots from a bitcoin-treasury story toward hyperscaler-linked AI infrastructure. The move is another reminder that public-company bitcoin demand is no longer one-way, especially where AI capex offers a competing use of capital.
|
| Macro |
|
|
|
The Terminal
The Terminal
Seven on-chain signals that historically pinpoint cycle bottoms. Paid subscribers see today's readings alongside every prior cycle bottom — upgrade to unlock. |
|
≡
|
COMMENTARY
VOICE FROM THE NETWORK
|
|
The AI assistant for admin tasks
Scheduling meetings isn't why you get out of bed. Filing expenses isn't your calling. So hand it all to Catch — the AI admin that takes the tedious work off your plate and gets it done.
Just ask. Catch handles the back-and-forth on scheduling, flights, restaurants, follow-ups, vendors, clients and more — then comes back with it sorted, in moments.
No guesswork. No dropped balls. What's yours stays yours, private by default and reliable by design.
JUST IN: Michael Saylor hints at another Bitcoin announcement tomorrow 👀 https://t.co/rIMOFioLdV
 62 reposts 80 replies 503 likes
|
|
Bitcoin bears are in for a HORRIBLE time. https://t.co/8wTMwuwGg9
 24 reposts 23 replies 304 likes
|
|
The next bull run happens in a little after 100 days.
This prediction is based on the 1,064/365 Bitcoin Cycle Theory.
Which suggests Bitcoin has historically spent around 1,064 days in a bull market followed by roughly 365 days in a bear market.
If the pattern continues, the next bull cycle could begin in the next 90 to 120 days.
 15 reposts 26 replies 115 likes
|
|
🇮🇹 ITALY’S LARGEST BANK, INTESA SANPAOLO DISCLOSED BUYING $235,000,000 WORTH OF BITCOIN AND CRYPTO
THEY ARE ALL COMING 🚀 https://t.co/5m8BGkNLOh
156 reposts 37 replies 890 likes
|
|
If $57K ends up being the bottom, two records break at once.
$BTC bear market drawdowns:
2014: -87.2% over 410 days
2018: -84.2% over 363 days
2022: -77.0% over 373 days
2026: -54.4% over 278 days... so far.
The shallowest bear market in Bitcoin's history, and it's not even close. The previous record improvement between cycles was 7 percentage points. This one would be 23.
And it would be the fastest bottoming in BTC's history.
Every prior bear needed 363 to 410 days to find its low. This one would have done it in 278. More than 100 days ahead of the average, nearly 3 months ahead of the fastest bottom ever printed.
The drawdowns have been compressing for a decade. That part is on trend, and it's exactly why I don't expect a -77% style capitulation this time.
The clock is a different story. Every bear market has needed 363 to 410 days to find its low.
Time is the one part of cycle structure that has never compressed.
So the most likely outcome is the boring one. The price damage may be mostly done, but the bottoming phase isn't.
More time, more chop, and the real low forming inside the historical window later this year.
 95 reposts 56 replies 286 likes
|
|
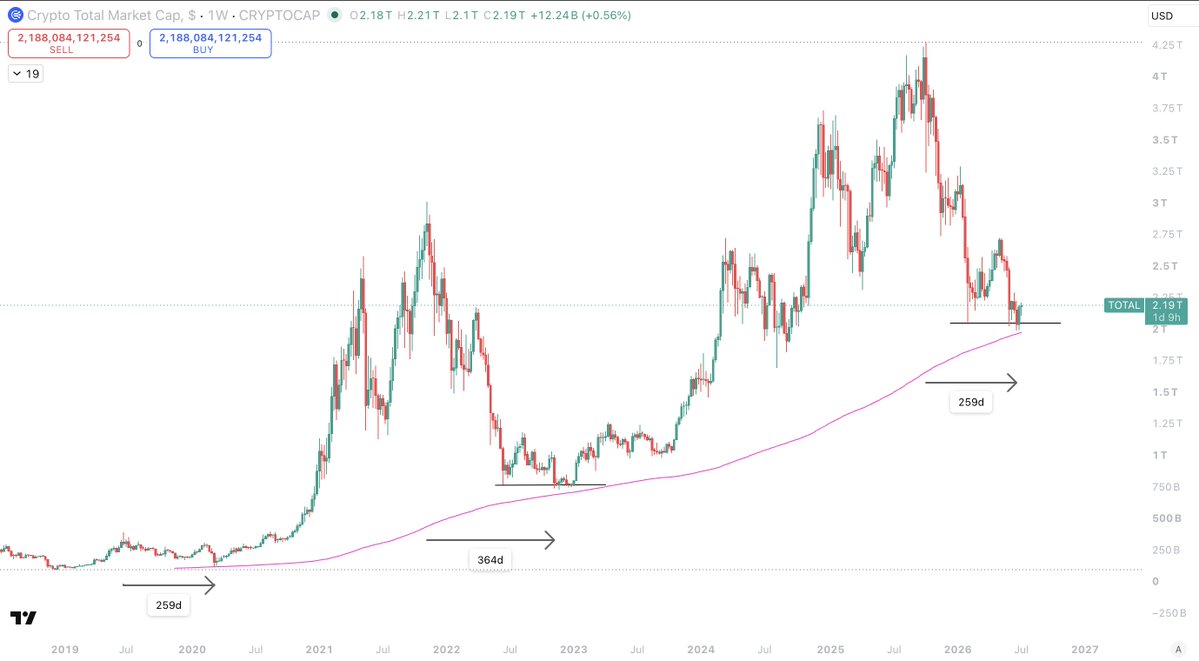
This is a huge data point to understand.
The TOTAL Crypto market cap has reached the same levels of oversold as both the:
- 2020 COVID low
- 2022 Bear market bottom
It's actually overextended the 2022 bottom.
And this is based on the 1W 300D SMA.
But what is most interesting about this chart is how this Bitcoin bottom has combined different elements from 2020 and 2022.
We have a macro low sweep + 1W Bullish divergence like we did in 2022.
And we have a shorter time period to the bottom, 259 days, like we did in 2020.
As my loyal followers will know, I believe we have bottomed faster because where we are is actually a mid cycle correction.
Bitcoin has never gone below the 1W 300 SMA.
Of course, we cant ever say it will not.
But its a very deep level that has always been respected, and only actually tagged properly once.
TOTAL looks bottomed.
 120 reposts 19 replies 424 likes
|
|